
Technology
The Real Cost of Mud: Why Cleaning Vehicles at the Gate Pays for Itself


Mud rarely appears as a line in a project budget, yet it costs money in many small ways. A site that ignores it often pays through clean-up bills, lost time and strained relationships. Looking at those costs side by side makes the case for prevention easier.
The visible costs
The most obvious expense is cleaning. Hiring a road sweeper regularly, or even daily during wet weather, adds up quickly over a long project. If a highway authority steps in and cleans the road itself, it usually recovers the cost from the contractor. Fines and enforcement notices are a further risk when a site repeatedly fails to keep the road clean.
The hidden costs
Delays are harder to measure. A stop-work instruction after a complaint, a meeting with the council or an extra clean-up shift all take managers away from the actual build. Mud also wears equipment faster, because wet soil in wheel arches and on tracks adds weight and hides defects until they become expensive.
Reputation and relationships
Neighbours notice dirty roads before they notice anything else about a site. A steady stream of complaints can damage relationships with local residents, councillors and the client. On projects where goodwill matters, this can influence later approvals and future work.
What prevention costs
A wheelwash system involves an upfront investment or a rental fee, plus water, power and routine maintenance. Systems that recycle water keep the running cost down. Compared with weeks of repeated sweeping and disputes, many contractors find that the equipment pays back within a single wet season on a busy site.
How to do your own calculation
List what mud costs your current projects: sweeper hire per week, hours spent on clean-up and complaint handling, any enforcement action, and the effect of delays. Then compare the total with the cost of renting or buying a cleaning system over the same period. Include installation, water and sludge disposal in the second figure for an honest comparison.
When the numbers matter most
Prevention pays most where soil is heavy clay, traffic is frequent and the site is close to homes or busy roads. On a small job with a single exit and dry ground, a lighter solution may be enough. The right answer depends on your conditions, not on a rule of thumb.
Conclusion
The cheapest mud is the mud that never reaches the road. Contractors who count the hidden costs usually find that a good cleaning facility is not an extra but a way of protecting time, budget and reputation.


Every hardware company reaches the same decision: build boards yourself, or hand PCB assembly to someone else. A small SMT line looks affordable until you add ovens, inspection gear, trained operators and a stockroom. Outsourcing looks simple until a supplier misses a deadline. Neither path is automatically better. This guide explains how EMS manufacturing works, where in-house assembly still wins, and how to choose the right model for your volumes and risk tolerance.
What Is EMS Manufacturing?
EMS manufacturing refers to Electronics Manufacturing Services: contract providers that build electronic products for other companies, known as OEMs. The scope runs from basic PCB assembly to component procurement, testing, box build and logistics. Some OEMs outsource only the boards and finish the product themselves. Others hand over the entire chain, from purchasing to shipping.
What Are the Benefits of Outsourcing PCB Assembly?
Outsourcing PCB assembly lowers upfront investment, gives you access to modern equipment and lets you scale output without hiring. You pay per unit or through setup fees instead of carrying fixed costs whether the line is busy or idle.
Lower Capital and Variable Costs
An in-house line costs the same in a slow month as in a busy one. An EMS partner spreads equipment and labor across many customers, so your cost moves with your order volume. Savings estimates vary widely between sources, and the real figure depends on your volumes, so treat any single percentage with caution.
Certifications and Process Maturity
Established EMS providers typically already hold quality certifications and run documented inspection routines. Building that capability yourself means hiring quality staff and earning audits from scratch.
When Does In-House PCB Assembly Make More Sense?
In-house assembly makes more sense when you need tight control over sensitive designs, run very high volumes of one stable product, or iterate on prototypes daily. It also suits companies that already own the equipment and the people to run it.
The trade-offs are real:
- Equipment and floor space tie up capital.
- Skilled operators and process engineers are hard to hire and keep.
- Volume swings leave the line either idle or overloaded.
What Are the Risks of EMS Manufacturing?
The main risks are quality drift, supply disruption, communication gaps and intellectual property exposure. The wrong partner can erase every benefit above through delays and rework.
You can manage most of these. Sign an NDA, define acceptance criteria in writing, and ask how the provider handles component shortages before you place an order. For sensitive designs, some companies keep final assembly or firmware loading in-house and outsource the rest.
Which Products Suit EMS Manufacturing?
Most electronics suit it, but the fit varies. Consumer devices benefit from scale and fast turnaround. Industrial control PCBA often needs long product lifecycles, component traceability and stable sourcing, so you should ask whether a provider can support the same board for years instead of months. Medical, automotive and aerospace builds add regulatory documentation on top.
Can You Combine In-House and Outsourced PCB Assembly?
Yes, and a hybrid model is common. A typical split keeps prototypes and pilot runs in-house, then moves volume production to an EMS partner. Another keeps test development internal while the partner handles assembly and box build. This works well when your design is still changing but your demand is growing.
How Do You Choose an EMS Partner?
Decide first what you’re outsourcing: boards only, full builds, or the entire supply chain. Then judge providers on:
- Their DFM feedback before quoting
- Test and inspection capability
- Component sourcing and shortage handling
- Experience with products like yours
- How quickly engineers respond
Invite two or three providers to review your files. Their questions will tell you more than their brochures.
Conclusion
Outsourcing PCB assembly suits companies that want flexibility, lower capital cost and access to mature processes. In-house assembly suits those that value control above all. Many land somewhere between. Start by listing your volumes, your IP concerns and your quality requirements, then choose the model that fits them.
Technology
Red, amber, green and the one in twelve men who cannot tell them apart: designing dashboards everyone can read

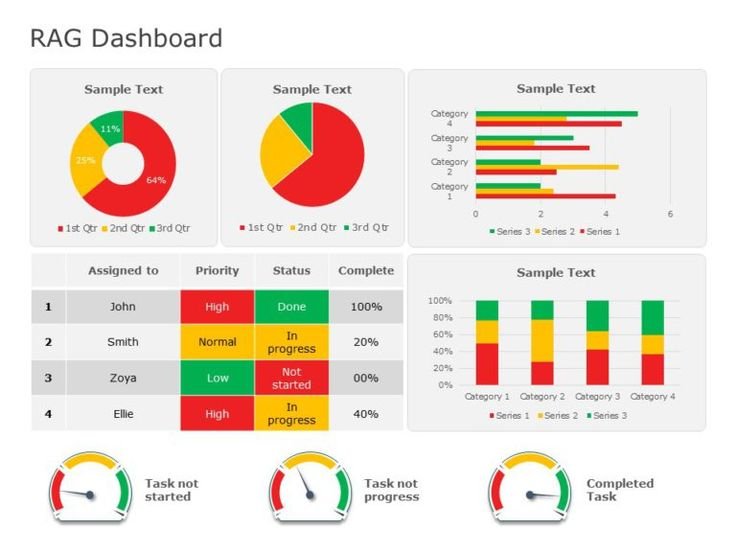
Picture a Monday operations meeting. The sales dashboard goes up on the wall screen, twenty tiles in a grid, each one coloured red, amber or green to show whether a region is on target. The director asks the room what needs attention this week, and most people point at the three red tiles straight away. One of the regional managers says nothing, because to him the red and the green tiles look much the same shade of brownish grey, and he has spent the last minute reading the small numbers underneath instead, working out for himself which ones are the problem.
He has plenty of company. The National Eye Institute in the United States puts colour vision deficiency at about one man in twelve. A peer-reviewed review in the journal Eye (Simunovic, 2010) gives a similar picture, with inherited colour vision deficiency affecting up to 8% of males and around 0.5% of females. In a company of 120 people, that is likely to be eight or nine colleagues, and there is a fair chance at least one of them sits in a meeting where a traffic-light dashboard is the main thing on the screen.
What the traffic lights look like to them
Colour vision deficiency, often called colour blindness although very few people see no colour at all, usually comes down to a weakness in one of the three types of light-sensitive cone cells in the eye. The two most common forms both affect the red and green cones, which is why red and green are the pair people have trouble telling apart. Pure red and pure green on a white background can often be separated by brightness alone. Problems start when a designer picks a softer palette, or when amber enters the picture, because amber sits between red and green and tends to collapse into both.
So a red, amber, green status column, with no other cue, asks a chunk of the audience to guess. They will usually guess correctly using context, or read the raw figures, or ask a colleague after the meeting. All of which takes time and attention that the dashboard was supposed to save.
The same visual breaks down for everyone else more often than people expect. Meeting-room projectors wash out saturated colours. A report printed on a black-and-white office printer turns every status into a grey square, and a phone screen outside on a bright afternoon does something similar. Designing for the one in twelve means the report survives those situations as well.
The grey text and the pale gridline
Contrast is the second accessibility fault in dashboards, and it catches far more readers than colour alone does.
The WebAIM Million, an automated survey of the top one million website home pages, found in its February 2026 run that 83.9% of them contained text with insufficient colour contrast, up on the 79.1% recorded a year earlier. Those are home pages built by professional web teams. Business dashboards are rarely built with that level of attention, and the default styling of many charting tools leans towards light grey axis labels, pale gridlines and thin pastel legends because they look clean on a designer’s large monitor.
On a wall screen three metres away, light grey on white vanishes. The reader can see the bars but not the months along the bottom, or the scale up the side, so a chart that looked tidy in Power BI Desktop becomes a set of coloured shapes with no reference points. The fix costs nothing: dark text on a light background, gridlines either dark enough to see or removed altogether, and legend labels in the same size and weight as body text. Labels that are only decoration can go, and the ones that carry meaning need to be legible at the distance the audience will read them.
Pair colour with shape, text or position
Nobody is suggesting dashboards go monochrome. Colour is a fast, pleasant signal for the roughly eleven in twelve who read it comfortably. The design rule, borrowed from web accessibility guidance, is that colour should never be the only way a piece of information is conveyed.
In practice that means three habits. Add a shape: an upward or downward arrow, a tick or a cross, a filled or hollow circle next to the colour. Write it out as text, because a tile that says “6% behind target” in words is readable by everyone, including the person reading it aloud on a conference call to colleagues who cannot see the screen. And use position, by sorting the table so the regions furthest behind sit at the top where the eye goes first, so the ordering itself tells the story without any colour at all.
There is a quick test for whether this has worked. Print the page in greyscale, or switch on the colour filter in Windows accessibility settings and set it to simulate deuteranopia (the most common red-green form). If the status of each item is still obvious, the design is sound. If every tile goes the same mid grey and nothing on the page tells you which region is behind, the colour was carrying the whole message.
Fewer numbers on the page
Accessibility and plain readability overlap more than people assume. A page with thirty figures on it is hard work for anyone, and it is harder still when some of those figures are differentiated only by a hue the reader cannot see.
A useful discipline is to decide, before opening the tool, what question this page answers and which three or four numbers answer it. Everything else moves to a second page or a drill-through (a click that opens the detail behind a figure). Each number then gets room: a readable label, a comparison with target or with last period written in words, and a colour cue backed up by one of the methods above. Red Eagle Tech has published a set of worked Power BI dashboard examples showing what this looks like when each page is organised around one decision rather than around everything the data happens to contain.
The result is often a report with more pages and less on each one, which can feel like a step backwards to anyone who grew up with the single giant spreadsheet tab. It reads faster in a meeting, and it reads at all for the colleague with colour vision deficiency.
Why this is learned fastest with someone critiquing your work
Everything above can be read in an afternoon. Turning it into habit is another matter, because the person building the report is also the person least able to see its faults. They know what the colours mean and which tile is the problem region, and they chose the pale grey because it looked elegant on their own monitor. The faults only show when somebody else sits in front of the report cold and tries to answer a question with it.
That is why report design sticks fastest in a hands-on setting where you build something and then have it pulled apart in front of you. Red Eagle Tech, a North London software and Power BI training company and a Microsoft Partner, runs this two-day course live online over Microsoft Teams, so delegates anywhere in the UK can join a small group where every exercise is built on real datasets and reviewed with the trainer. The sixth of its seven modules is given over to designing interactive reports, covering report design practice, custom visuals and row-level security (the permissions that control who sees which rows of data). The trainer has led Power BI training across a FTSE 100 company, the firm has trained more than 200 people, and Clutch named it a Top Power BI & Data Solutions Company in London for 2026. The fee is £600 + VAT per person.
The lasting lesson in that kind of session is usually the moment a colleague squints at your chart and asks what the grey line means, and you realise nobody had asked before.
A ten-minute check before the next meeting
Open the report you will present next week. Switch on the greyscale filter and look at it as the one in twelve will. Then zoom the browser out to roughly the size it will appear on the wall screen and see whether the axis labels are still readable where you sit. Whatever fails those two checks is the thing to fix first, and in most reports it is a single colour-only status column and one set of light grey labels. Both can be changed before Monday.

The Hidden Vulnerability of Smart Manufacturing (Industry 4.0)
The Disproportionate Cost of Transient Overvoltages
The transition to Industry 4.0 has transformed traditional factory floors into highly interconnected ecosystems. While this connectivity drives unprecedented efficiency, it introduces a severe Achilles’ heel: extreme sensitivity to electrical disturbances. Modern Programmable Logic Controllers (PLCs) and sensitive microprocessors operate at very low logic voltages, making them highly susceptible to electrical spikes.
In smart manufacturing environments, the integration of sensitive microprocessors and Industrial IoT (IIoT) sensors introduces a critical vulnerability to transient overvoltages. A single voltage spike from internal heavy machinery switching can cripple an entire automated production line.
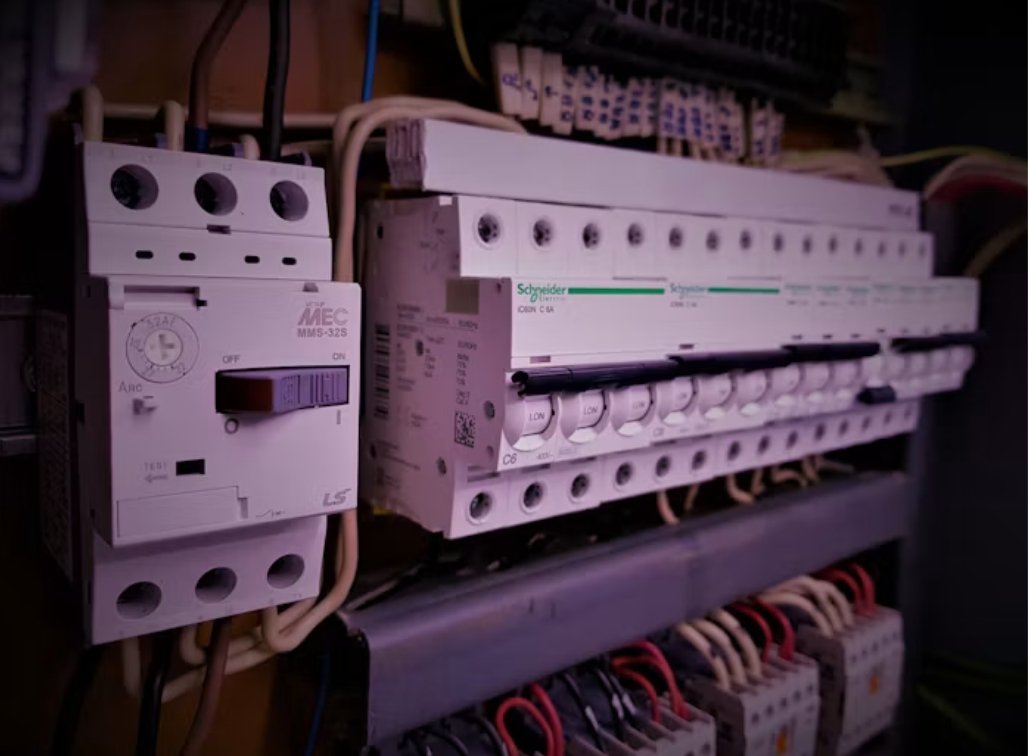
To safeguard these critical assets, facility engineers must integrate an industrial-grade LSP at key power distribution nodes. These specialized components act as a critical defense layer, detecting voltage anomalies and instantly diverting destructive currents to the ground in nanoseconds, thereby preventing catastrophic downtime.
Internal grid switching, variable frequency drives (VFDs), and heavy machinery cycling are the primary culprits for these internal micro-surges. Without robust protection, the disproportionate cost of a single electrical transient can quickly exceed millions in halted production and damaged hardware.
How PLCs and Sensors Degrade Under Electrical Stress
Catastrophic failure is not the only threat facing smart manufacturing facilities. A more insidious problem is the silent, progressive degradation of electronic components when exposed to chronic, low-level electrical noise.
Continuous voltage fluctuations act as a form of electronic fatigue on semiconductor junctions. Over time, this constant electrical stress compromises the internal insulation of PLCs and optical sensors, significantly reducing their expected lifecycle.
- Dielectric breakdown: Continuous micro-surges slowly erode the insulating layers within integrated circuits.
- Data corruption: Electrical noise disrupts the binary logic, causing intermittent sensor misreadings.
- Thermal fatigue: Frequent clamping of minor overvoltages generates heat, degrading the physical solder joints.
Facility managers must recognize that a lack of immediate hardware failure does not equate to a healthy electrical environment. Unmitigated stress guarantees premature system mortality.
Designing a Robust Power Quality Strategy
Implementing Zonal Protection (LPZ Concept)
To properly shield an automated facility, electrical architects utilize the concept of Lightning Protection Zones (LPZ). This engineering framework divides a manufacturing plant into specific zones based on their exposure to electromagnetic threats.
Rather than relying on a single point of defense, the LPZ strategy employs cascading protection. It isolates different factory sections, preventing electrical failures from propagating through the entire grid.
- LPZ 0 to LPZ 1: The transition at the main service entrance, intercepting massive external surges.
- LPZ 1 to LPZ 2: Sub-distribution panels isolating heavy machinery from sensitive control rooms.
- LPZ 2 to LPZ 3: Terminal protection directly at the input of highly sensitive IIoT assets.
By physically and electrically compartmentalizing the factory, engineers can effectively quarantine electrical transients before they reach mission-critical assembly lines.
Proper Grounding Techniques in Industrial Automation
Standard commercial grounding is entirely insufficient for the complexities of a smart factory. In Industry 4.0, a highly engineered, low-impedance grounding system is the foundational prerequisite for all surge protection and data integrity.
In complex Supervisory Control and Data Acquisition (SCADA) networks, improper grounding frequently creates devastating ground loops. These loops occur when different parts of a communication network are grounded at slightly different potentials, driving unwanted current through data cables.
- Single-Point Grounding: Essential for low-frequency sensitive equipment to prevent circulating currents.
- Equipotential Bonding: Creating a uniform baseline potential across all metallic chassis and conductive structures.
- Shielding and Routing: Physically separating power cables from data transmission lines to prevent inductive coupling.
Predictive Maintenance and System Resilience
Real-Time Power Monitoring Protocols
In modern energy management, reacting to an outage is an obsolete strategy. Predictive maintenance leverages real-time data to identify developing electrical anomalies long before they trigger physical damage or system shutdowns.
By deploying smart meters and advanced power quality analyzers, facility directors can continuously monitor the health of the plant’s electrical infrastructure. This proactive stance ensures that power quality remains within the strict tolerances required by automated machinery.
- Harmonic Analysis: Tracking non-linear loads that distort the pure sinusoidal waveform of the AC power.
- Voltage Sag/Swell Monitoring: Detecting grid instability that could cause machinery to misfire or stall.
- Transient Logging: Recording the frequency and magnitude of micro-surges to assess the remaining lifespan of existing protection devices.
Regulatory Compliance and Factory Safety Standards
Aligning with International Electrotechnical Frameworks
Implementing a resilient electrical infrastructure goes beyond mere asset protection; it is inherently tied to global operational compliance. Modern automated factories must adhere to stringent codes to ensure worker safety and maintain international certifications.
By strictly following the global standards for electrotechnical safety and power quality, plant managers can establish a baseline for electrical reliability that satisfies both operational demands and rigorous regulatory audits.
Adherence to definitive engineering blueprints—such as those published by the IEC (International Electrotechnical Commission) and IEEE—guarantees that a facility’s power protection strategy is scientifically validated. Compliance is not just a legal formality; it is the ultimate assurance of a factory’s long-term operational resilience.

The Real Cost of Mud: Why Cleaning Vehicles at the Gate Pays for Itself

Best Place to Buy Business Laptops in Bulk in the UK

Seedworld, a Red Coat, and the Weather in a Fashion Story

A Silk Scarf, Seedream 6.0, and a More Considered Fashion Still Life

How to Get and Compare Business Water Quotes Properly

Who Is Indiana Urban? Inside the Life of Karl Urban’s Son and Rising Actor

Jennifer Seyfried: All About Amanda Seyfried’s Sister, Her Life and Career

Who Is Zachary Hudson? Inside the Private Life of Cindy Williams’ Son

Who Is Stephen G. Walker? All About PinkPantheress’ Father and His Academic Career

Cynthia Womack Biography: The Life, Career, and Legacy of Connie Britton’s Twin Sister
Who Is Indiana Urban? Inside the Life of Karl Urban’s Son and Rising Actor
Jennifer Seyfried: All About Amanda Seyfried’s Sister, Her Life and Career
Who Is Zachary Hudson? Inside the Private Life of Cindy Williams’ Son
Who Is Stephen G. Walker? All About PinkPantheress’ Father and His Academic Career
Cynthia Womack Biography: The Life, Career, and Legacy of Connie Britton’s Twin Sister
-
Biography8 months ago
Who Is Indiana Urban? Inside the Life of Karl Urban’s Son and Rising Actor
-
Biography8 months ago
Jennifer Seyfried: All About Amanda Seyfried’s Sister, Her Life and Career
-
Biography8 months ago
Who Is Zachary Hudson? Inside the Private Life of Cindy Williams’ Son
-
 Biography7 months ago
Who Is Stephen G. Walker? All About PinkPantheress’ Father and His Academic Career
-
Biography9 months ago
Cynthia Womack Biography: The Life, Career, and Legacy of Connie Britton’s Twin Sister
-
 Biography7 months ago
Lynn Payne: Inside the Life and Love Story of Randy Savage’s Wife
-
 Biography7 months ago
Who is Lynn Levesque? Everything to Know About Triple H’s Sister
-
 Biography9 months ago
Who Was Gretchen Knauff? The Private Life of Jennifer Coolidge’s Mother